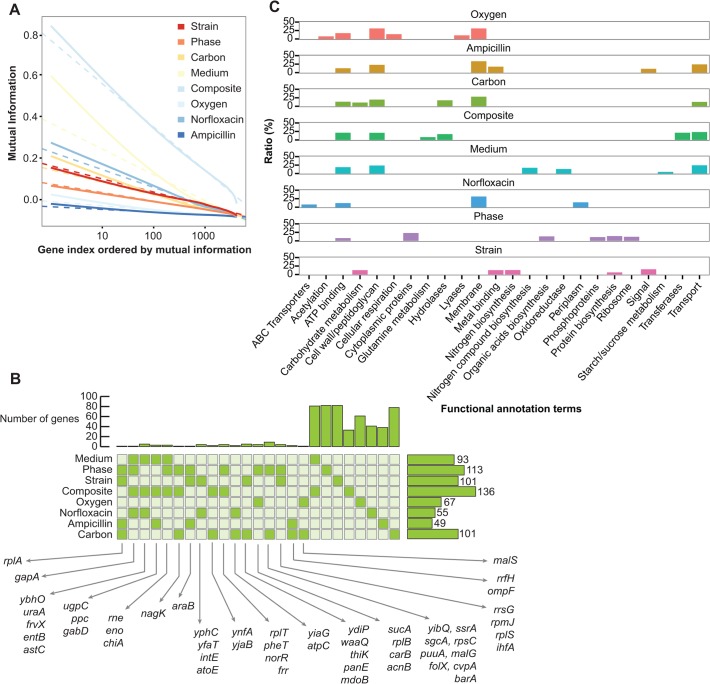
Fig 4. Feature and functional enrichment analysis.
(A) Mutual information (MI) content for each of the 8 classifiers. The 4166 genes are sorted by decreasing order of their MI. Solid and dashed lines correspond to empirical data and inverse log-linear fitting, respectively. (B) The common set of the most informative genes across different classifiers. For each of the 8 classifiers, genes that account for top 10% of MI of all genes are extracted (side bars depict the size of the corresponding gene set). The top histogram depicts the size of the unique features (genes) per classifier. (C) Functional annotations of the selected features for each classifier. The six most significantly enriched ontology terms are depicted. As some of functional terms were synonyms, we extract the non-duplicated associated terms. Ratios represent the proportion of the specific ontology terms present in a MI gene set.

