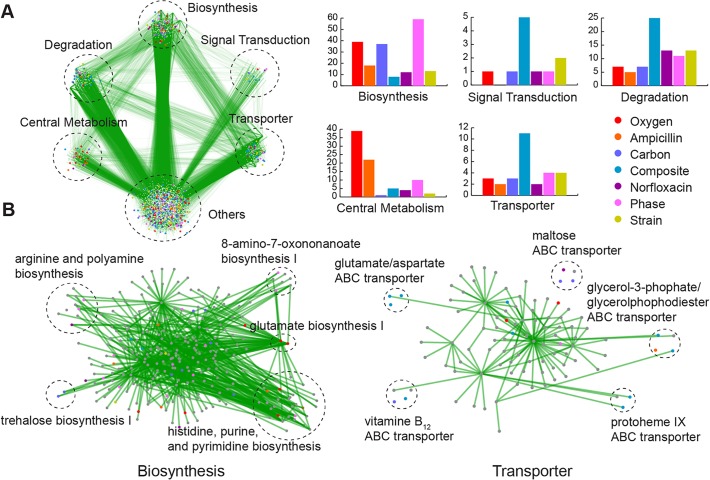
Fig 5. Highly informative genes on a genetic interaction network.
(A) Genes are grouped into five separate modules that are distinct from the core network. Ontology of pathways and compositions of transporter complexes are based on EcoCyc for E. coli K-12 MG1655. Green edges represent genetic interactions identified in [47]. Histograms show frequencies of MI genes for different classifiers for 5 pathway modules. (B) A higher resolution representation for the biosynthesis and transporter complex pathways that are highly enriched in a number of classifiers. Genes shown are the top-ranked in each classification task. The node color denote the classification task that it is highly informative of (task legend on the upper right of the figure).

