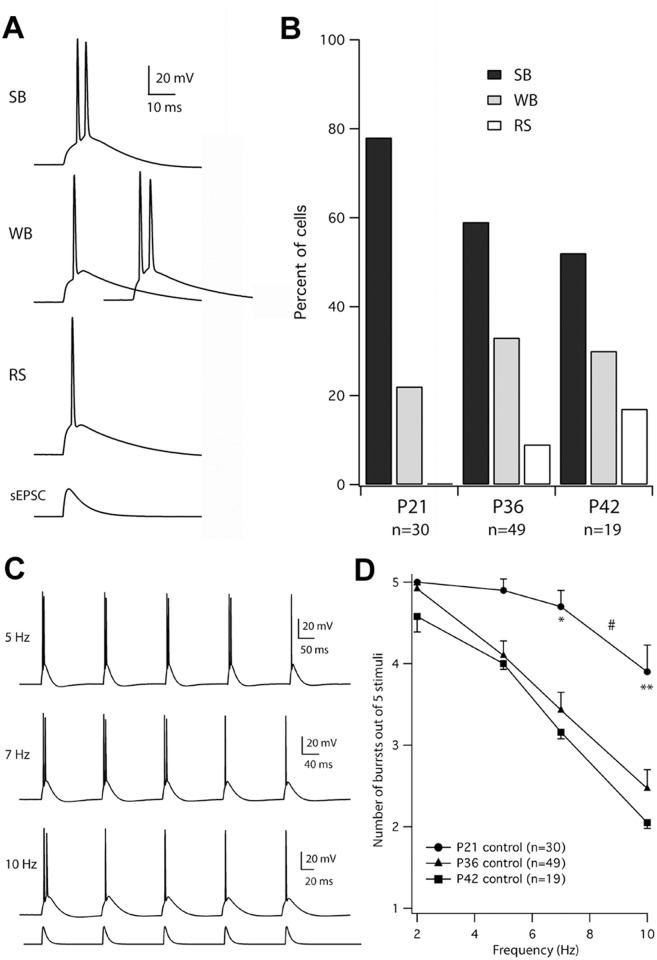
Fig 2. Variability and developmental changes in frequency-dependent bursting of subicular neurons.
A. Whole-cell current-clamp recordings in response to brief sEPSCs. Top: a strong-bursting (SB) neuron exhibiting bursting in response to an sEPSCs at threshold for spiking (1.05 nA). Middle: a weak-bursting (WB) neuron exhibiting single spiking at threshold (1.25 nA) and bursting just above threshold (1.45 nA). Bottom: a regular-spiking (RS) neuron exhibiting single spiking at threshold (1.70 nA) and well above threshold (not shown). The time course of the sEPSC is shown at the bottom. B. The proportions of SB, WB, and RS neurons are plotted for saline-injected (control) animals (P15,21; P21,36 and P30,36 pooled; P30,42). C. Sample responses to sEPSC injection at 5, 7, and 10 Hz in a neuron from a P30,36 control rat. The current injection is shown schematically below the 10 Hz trace. D. The average number of bursts in response to five sEPSC injections delivered at 2–10 Hz decreased from the youngest (P21 control) to older (P36, control) and the oldest (P42 control) rats. #Burst-frequency curves are affected by age, p<0.0001 (two-way ANOVA). P21 is significantly different from P36 and P42: *p<0.05 and **p<0.01 (post-hoc Bonferroni multiple comparison).

