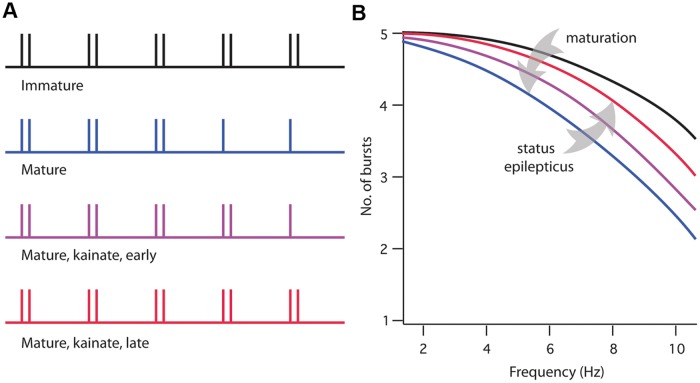
Fig 4. Schematic representation of developmental and KA-SE-induced changes in repetitive bursting in subiculum.
A. Digital representation of bursting at four stages and conditions. Double and single vertical lines represent bursts and single spikes, respectively. Each train represents the response to five stimuli. B. Schematic plots of the number of bursts (in response to five stimuli) versus frequency at each of the stages and conditions shown. Arrows indicate the decreased bursting during maturation and the increased bursting in the latent period following status epilepticus.

