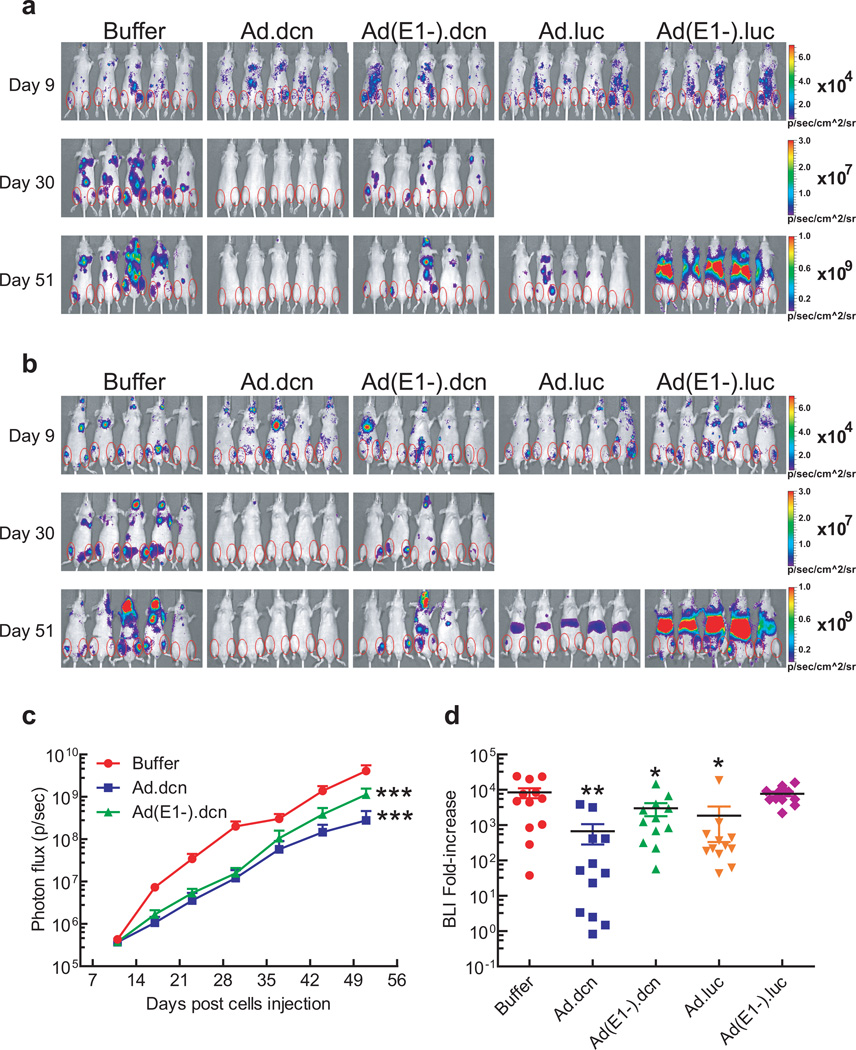
Figure 3.
Effect of adenoviral vectors on skeletal tumor progression by BLI analyses. (a) Representative whole body BLI images (dorsal view) on day 9, day 30 and day 51 are shown. (b) Representative whole body BLI images (ventral view) on day 9, day 30 and day 51 are shown. Regions of interest (ROIs) are shown with red circles in (a) and (b). (c) Skeletal tumor progression was monitored by the quantification of BLI signal intensities of combined dorsal and ventral hind limbs within ROIs and is shown. (d) Fold-increases of BLI signal intensity from day 9 to day 51 were calculated and are shown. P value comparisons with buffer group are shown for C and D (* represents p<0.05, ** represents p<0.01, *** represents p<0.001). (n=12, each treatment group).

