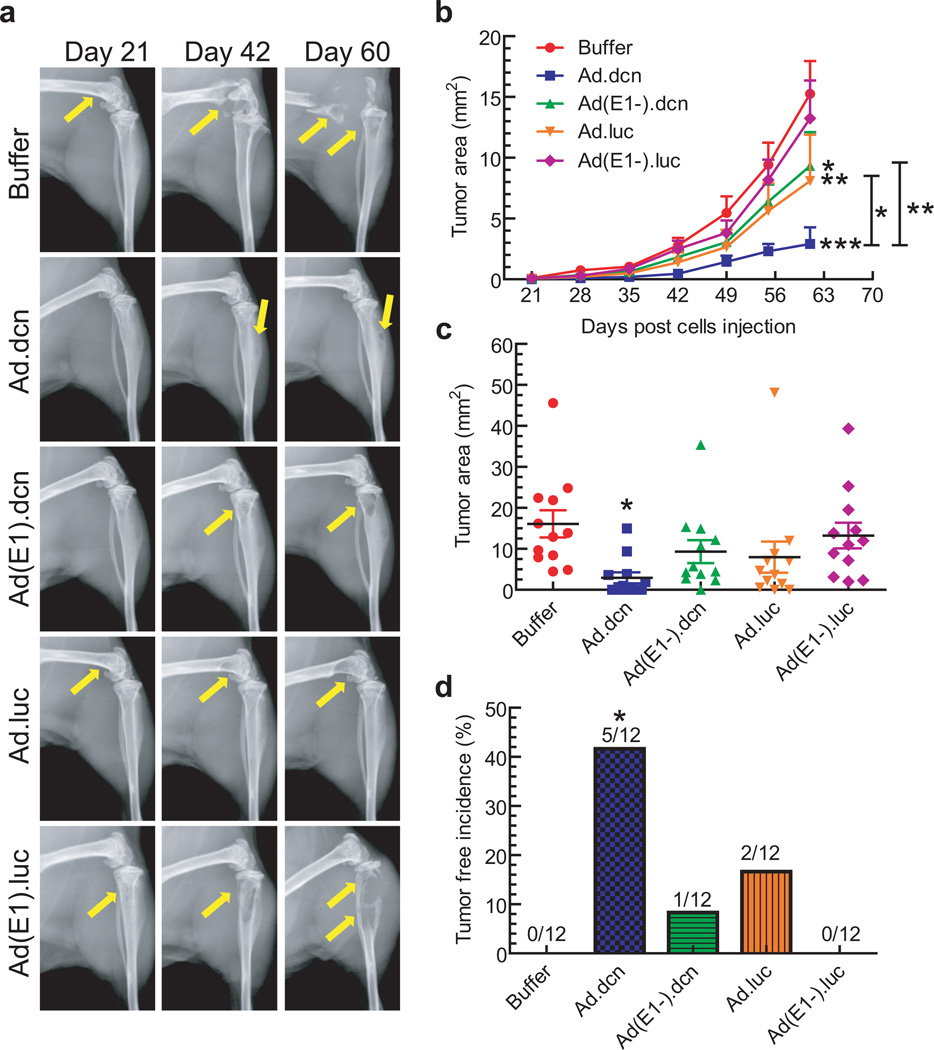
Figure 4.
Effect of adenoviral vectors on skeletal tumor progression by radiographic analyses. (a) Representative radiographs of mouse hind limbs on day 21, 42 and 60 are shown. Yellow arrows indicate the sites of osteolytic lesions. (b) Skeletal tumor progression was monitored by the quantification of radiography lesion sizes in both hind limb bones for the duration of the study and is shown. (c) Lesion sizes in the hind limb bones on day 60 were calculated and are shown. (d) Bone metastasis free incidences (mice without x-ray positive lesions) on day 60 are shown. P value comparisons with buffer group are shown for (b), (c) and (d), and between Ad.dcn and Ad.luc, and between Ad.dcn and Ad(E1-).dcn for (b) (* represents p<0.05, ** represents p<0.01, *** represents p<0.001). (n=12, each of the treatment group).

