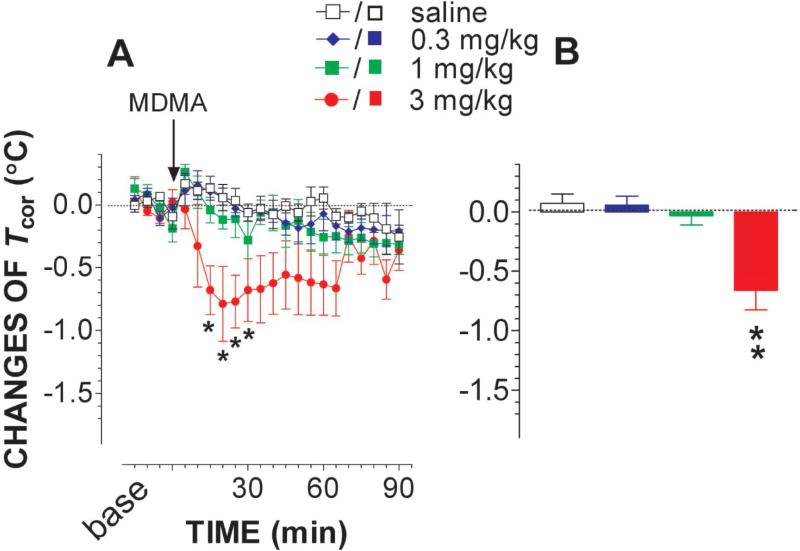
Figure 5.
Effect on body-core temperature (Tcor) of MDMA. Animals were moving freely in a test chamber at temperature of 22 °C. Data are mean ± s.e.m (N = 4-7). Time course of changes in Tcor is depicted in the line graph (A) and mean change during the time period of 0 - 45 min is displayed in the bar graph (B). Injection of 3 mg/kg MDMA, but not 0.3 or 1 mg/kg, caused significant reduction in Tcor. *P<0.05 and **P<0.01 vs. saline control.

