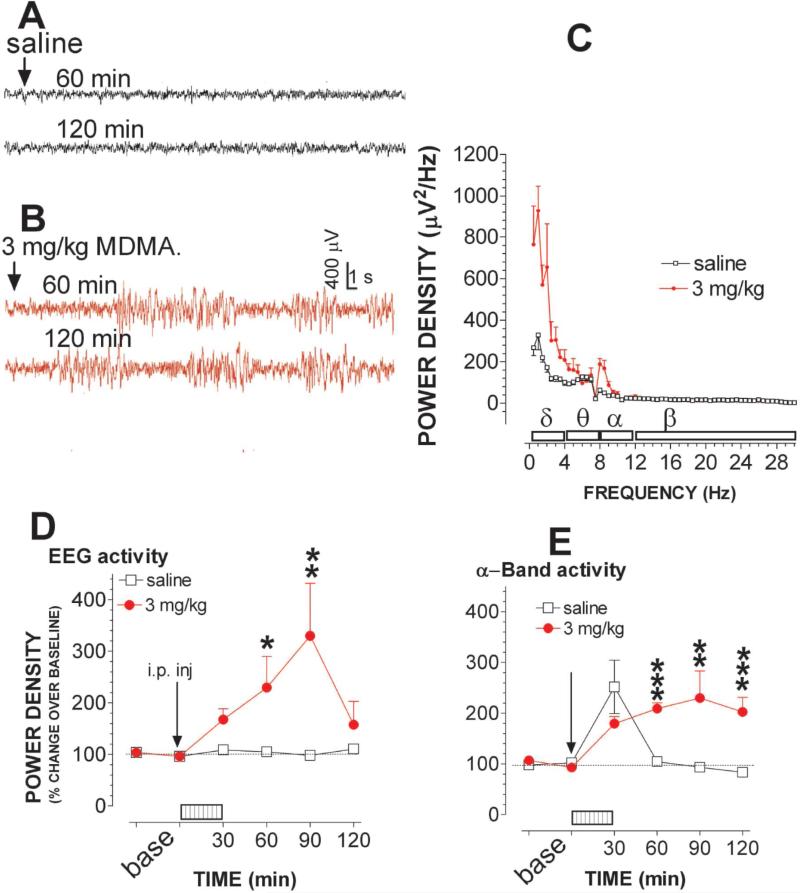
Figure 8.
Environmental factors altered the EEG response to MDMA. Animals were placed on a treadmill at 32 °C. The treadmill motor power was turned on during a time period of 0-30 min (see details in Methods section). A-B, Example of EEG traces represents EEG activity in the time frame of 60 min (top) and 120 min (bottom) after saline (A) or 3 mg/kg MDMA injection (B). Each tracer is a 30-s epoch. Time bar, 1 s; voltage bar, 0.4 mV. C, Representative analysis of power density, 60 min after MDMA injection. Data are mean ± s.e.m (N = 4 – 6; μV2/Hz). Horizontal bars indicate the frequency range of delta (0.5 - 4 Hz), theta (4-8 Hz), alpha (8 - 12 Hz) and beta-waves (12-30 Hz). D, Time-dependent effects on EEG activity. Data are expressed as percentage of basal level (N = 4 - 6). The combination potentiated MDMA-elicited changes in EEG activity over entire frequency (0.5 – 30 Hz). E, Time-dependent effects on α–band EEG activity (8 - 12 Hz) *P<0.05, **P<0.01 and ***P<0.001 vs. control animals at respective time points.

