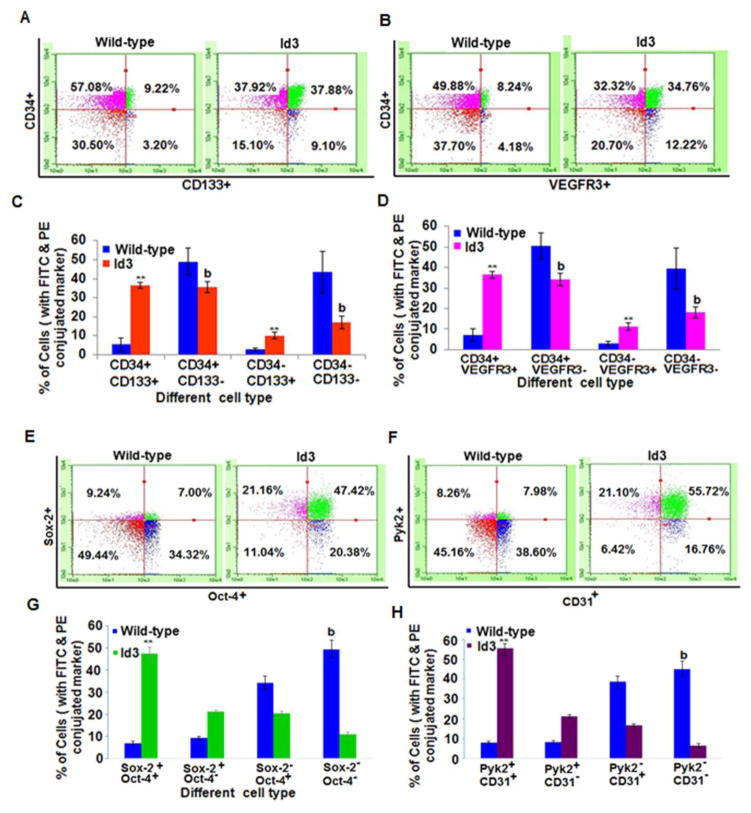
Fig. 1. Molecular endothelial stem signature induced by ID3 overexpression.
Cell surface expression of endothelial stem markers CD133, VEGFR3, CD34 was analyzed by two color flow cytometry. (A) Representative flow cytometry data analysis of EC wt and EC ID3+ analyzed for the co-expression of endothelial marker CD34 and stem marker CD133. (B) Representative flow cytometric analysis of CD34 and VEGFR3 co-expression in EC wt and EC ID3+. (C) CD133+ cells were approximately 7-fold higher in EC ID3+ compared to EC wt. Bar graph represents the flow cytometric data for CD133 and CD34 co-expression from three independent experiments ± SD. (D) VEGFR3+ cells were approximately 5-fold higher in EC ID3+ compared to EC wt. (E) Representative flow cytometry data analysis of EC wt and EC ID3+ analyzed for the co-expression of Sox2 and Oct4. (F) Representative flow cytometric analysis of CD31 and Pyk2 co-expression in EC wt and EC ID3+. (G) Sox2 and Oct4 positive cells were approximately 6.7-fold higher in EC ID3+ compared to EC wt. Bar graph represents the flow cytometric data for Sox2 and Oct4 co-expression from three independent experiments ± SD. (H) Pyk2 and CD31 positive cells were approximately 7-fold higher in EC ID3+ compared to EC wt. Graph of flow cytometric data for Pyk2 and CD31 co-expression derived from three independent experiments ± SD. Each column represents mean marker expression in either EC ID3+ **p<0.01 vs. EC wt for increase; or EC ID3+ b p<0.01 vs. EC wt for decrease. Data were analyzed by ANOVA; Tukey HSD test for multiple comparisons.

