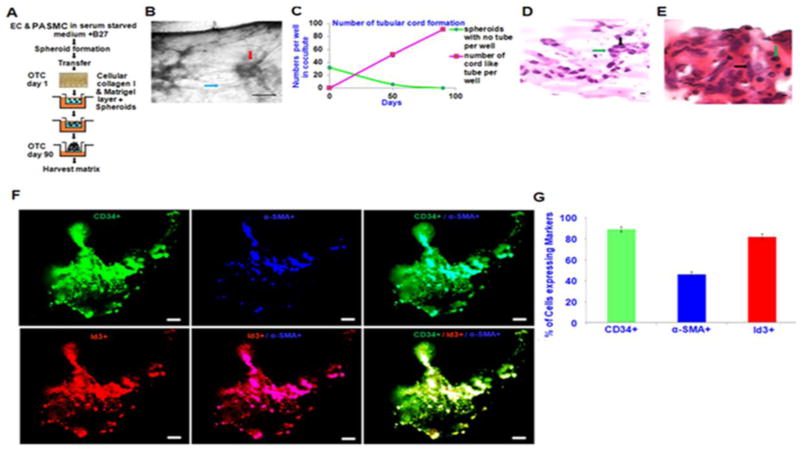
Fig. 7. EC ID3+ form 3-D microvascular lesions.
In vitro microvascular lesion formation by EC ID3+ was determined in 3-D culture when grown with PASMCs. Both the EC wt and EC ID3+ were seeded with PASMCs to form EC/SMC spheroids that were then transferred into well inserts containing a pre-cast 3-D gel matrix. Next, well inserts were cultured at 37°C for 90 days with a fresh change of serum-free DMEM-F12 supplemented with B27® every 15 days. (A) Diagrammatic representation of 3-D cell culture protocol. (B) Representative photomicrograph showing neovascularization and capillary-like formation among the spheroids in 3-D matrix. The spheroid indicated by the red arrow and capillary-like structure shown by the blue arrow. Scale bar=100 μm. (C) In graph, red line shows increasing number of tube structures from EC ID3+/SMC spheroids per well during the 90 day time period. (D) Representative photomicrograph of the H&E stained tube-like structure. Green arrow indicates the small circular morphology of ECs while the black arrow indicates the bigger spindle shaped PASMCs. Scale bar=50 μm. (E) Representative photomicrograph of the H&E stained spheroid cross-section with intact cellular core and lumen-like structures. (F) Co-localization of EC with SMC was determined by confocal microscopy after immunofluorescent staining of cells with antibodies against endothelial marker CD34 (green), smooth muscle marker α-SMA (blue), and ID3 (red). Representative images (top panel) show SMCs organize along the capillary-like structures and ECs composed the spheroid core. Bottom panel shows co-localization of ID3 overexpression with EC marker CD34. (G) Graph depicts percent of cells expressing each marker. Approximately 45% of the cells immunostained positive for α-SMA, 90% stained positive for endothelial marker CD34, and 80% stained positive for ID3. The error bars represent the mean of expressed marker positive cells ± SD in slides.

