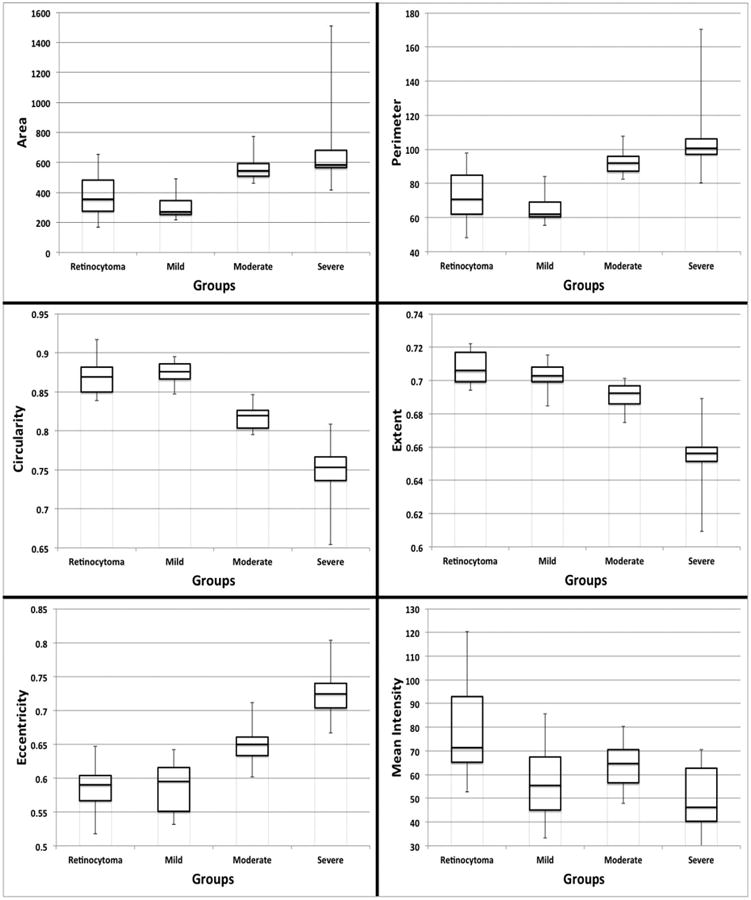
Figure 7.

Box plots showing differences in nuclear morphometric features of retinocytoma, mild, moderate and severe anaplasia grades of retinoblastoma. Top left and top right: Analysis of nuclear size in terms of area and perimeter shows no significant difference between retinocytoma and mild anaplasia, as well as between moderate and severe anaplasia groups; however both retinocytoma and mild anaplasia groups had significantly smaller nuclear sizes compared to moderate and severe anaplasia groups. Middle left, middle right, and bottom left: Tumor nuclei became progressively less round based on measurements of circularity, less regular based on extent, and more elongated based on eccentricity with increasing severity of anaplasia. Bottom right: Retinocytoma nuclei were significantly lighter or less hyperchromatic than retinoblastoma nuclei based on mean intensity. There were no significant differences in mean intensity of nuclei between the mild, moderate, and severe anaplasia groups. (horizontal lines represent median values, bars represent standard error)
