Figure 5.
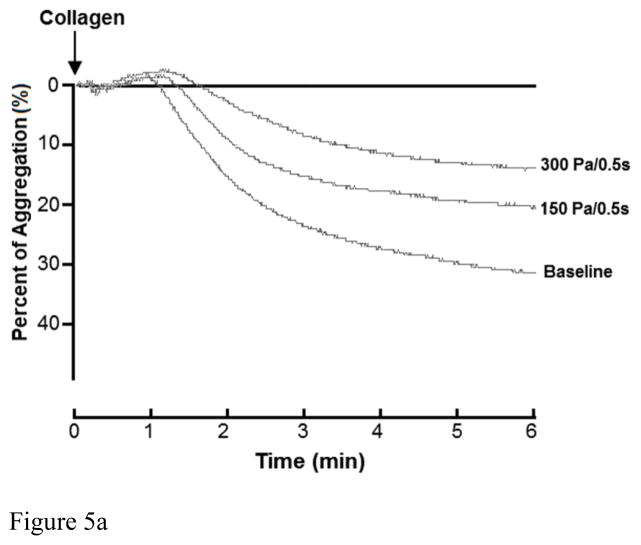
Figure 5A: The changing of impedance curve (aggregation curve) of the platelets aggregation induced by collagen among base sample and two sheared samples (150Pa/0.5s, 300Pa/0.5s). The platelet aggregation is indicated by area under the impedance curve. The time course of the platelets aggregation curve changing was recorded for 6 minutes
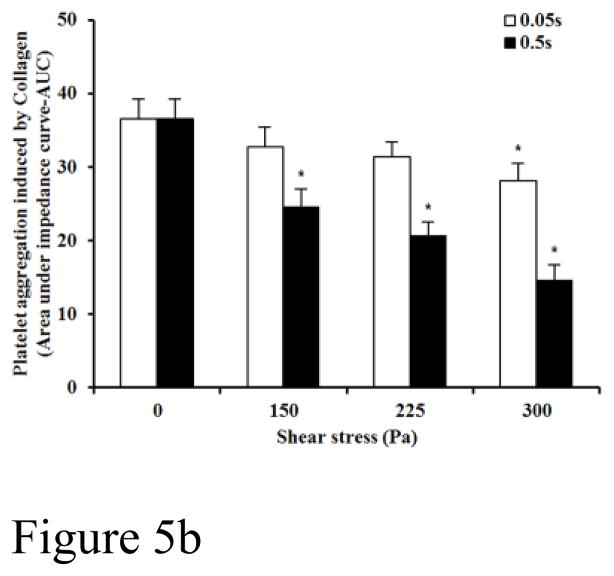
Figure 5B: The average comparing of platelet aggregation induced by collagen between base unsheared blood samples (0Pa) and sheared blood samples under three levels of high shear stress (150, 225, 300Pa) for two durations (0.05 and 0.5 sec.)(n=9). The platelet aggregation induced by collagen in y-axis is indicated by area under the impedance curve.


