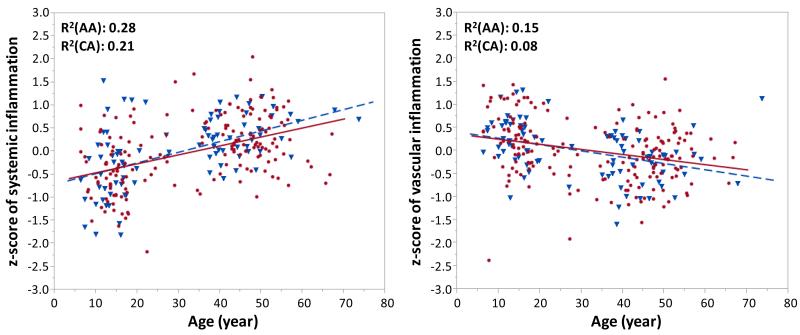
Figure 1. Relationship between age and composite z-scores of systemic or vascular inflammatory markers.
Composite z-score for each marker category was calculated as described in the Materials and Methods section. Linear regression model was used to describe the trend pattern of inflammatory marker levels over age for each ethnic group. Data for African-Americans are shown with blue triangles and a dotted line, whereas data for Caucasians are given with red circles and a straight line.
Abbreviations: AA, African-Americans; CA, Caucasians

