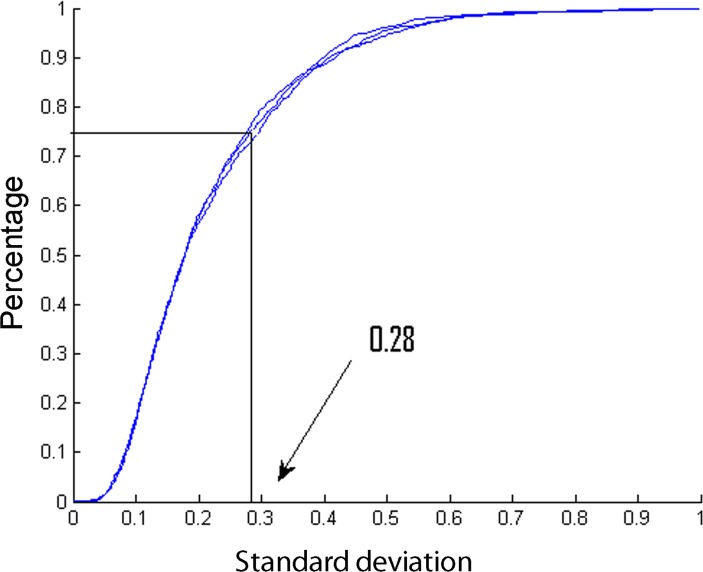
Fig 5. Representation of the percentage of peptides of the total variation set-up in function of the standard deviation of log intensity values.
The sample was injected in triplicate, indicated by color code blue. This graph demonstrates that 75% of the peptides in the three replicate runs do not have a standard deviation that exceeds 0.28. These numbers can be used in sample size calculations.

