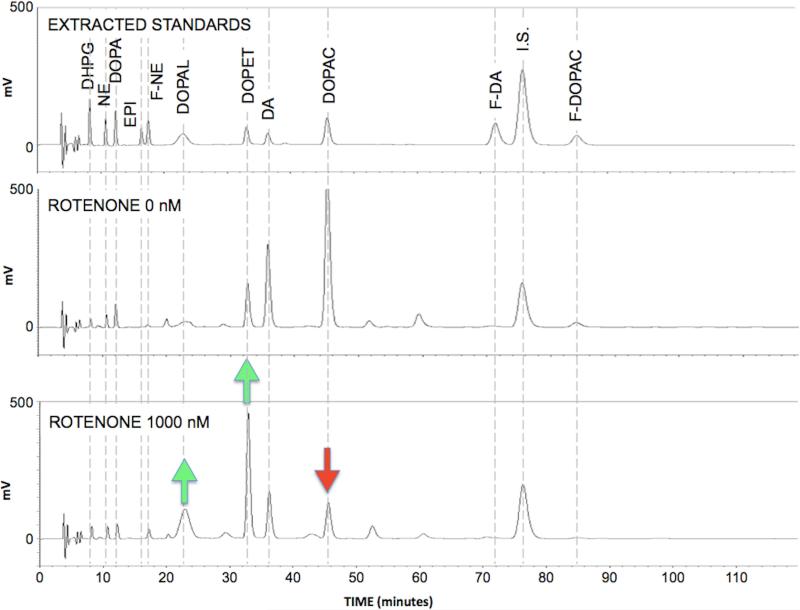
Figure 2. Chromatographs of (A) catechol standards, (B) medium catechols at a rotenone concentration of 0 nM, and (C) medium catechols at a rotenone concentrations of 1000 nM.
Green arrows placed to emphasize increases in DOPAL and DOPET chromatographic peak heights and red arrow to emphasize decrease in DOPAC peak height.

