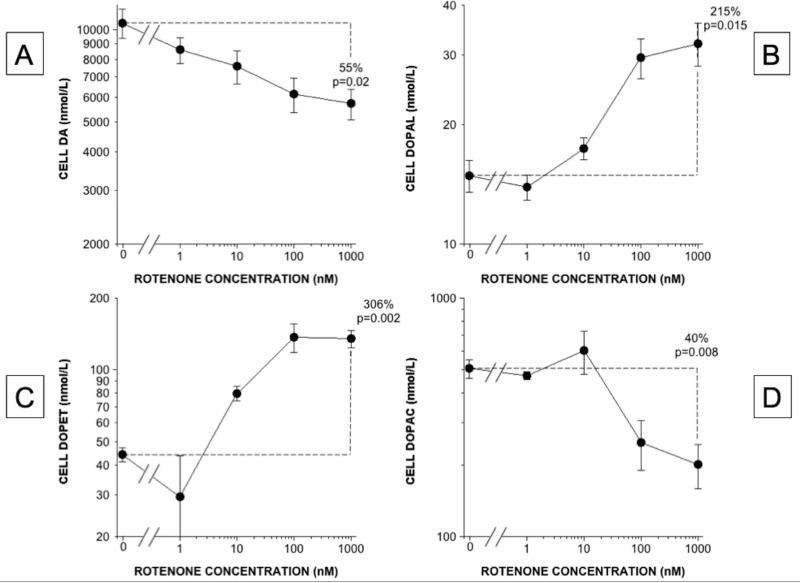
Figure 3. Rotenone effects on cell contents of DA and its deaminated metabolites in PC12 cells.
(A) DA; (B) DOPAL; (C) DOPET; (D) DOPAC. Mean (±SEM) concentrations are expressed as functions of rotenone concentrations on log-log scales. DA content decreased slightly across rotenone doses, contents of the deaminated metabolites DOPAL and DOPET increased exponentially, and DOPAC content changed bi-phasically, decreasing at the higher rotenone concentrations.

