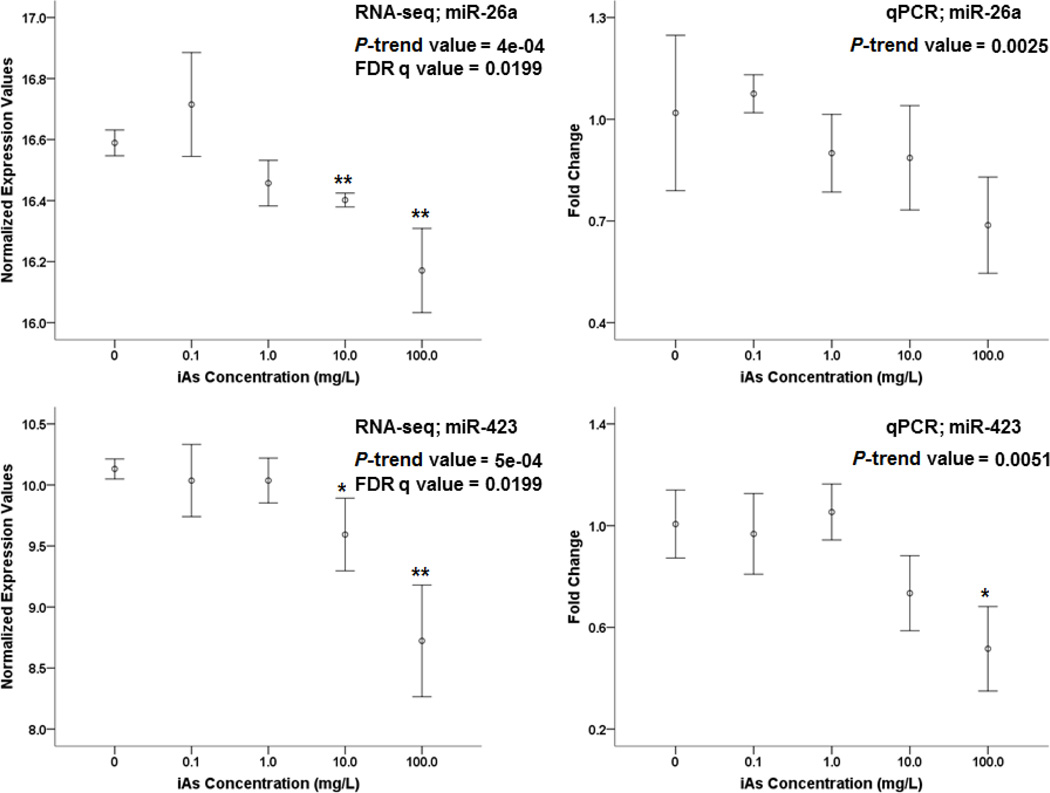
Figure 6. RNA-seq and qPCR results for miR-26a and miR-423.
The first column contains the RNA-seq normalized expression values as a function of iAs concentration while the second column contains the qPCR fold change estimates as a function of the same concentration levels. Both miR-26a and miR-423 were verified by qPCR at a nominal level of 0.05. The Jonkheere’s trend test p-values are listed in the figure subheadings for all plots. The Benjamini and Hochberg q-values are listed for the RNA-seq data. The data were expressed as mean ± SD (n=3). One-way ANOVA were applied to compare the differences in expression level between various arsenic concentration groups and control group (*, P <0.05; **, P < 0.01). The P values were from ANOVA results.

