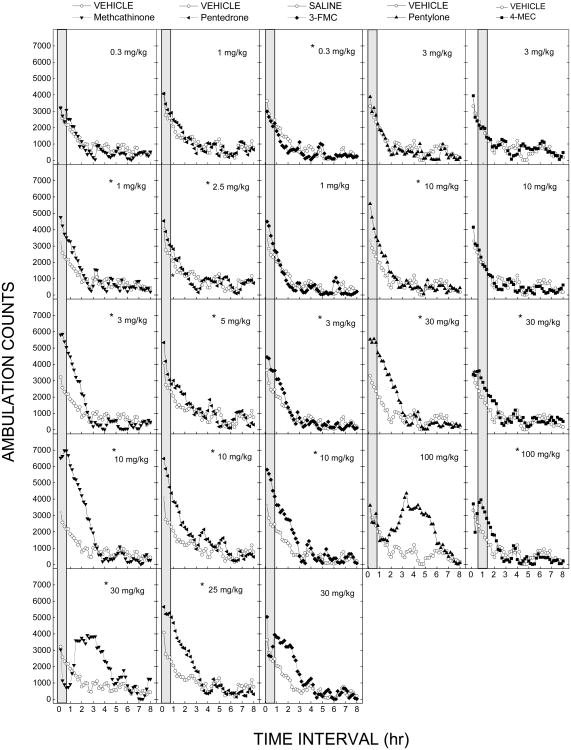
Figure 1. Time course of locomotor stimulant effects.
Average horizontal activity counts/10 min (Ambulation counts) as a function of time and dose for methcathinone, pentedrone, 3-FMC, pentylone and 4-MEC. Each panel shows the effects of one dose of compound versus the vehicle. n=8 for each dose. The gray bar shows the time range of peak effect. * indicates stimulant effects (p < 0.05) against vehicle control.

