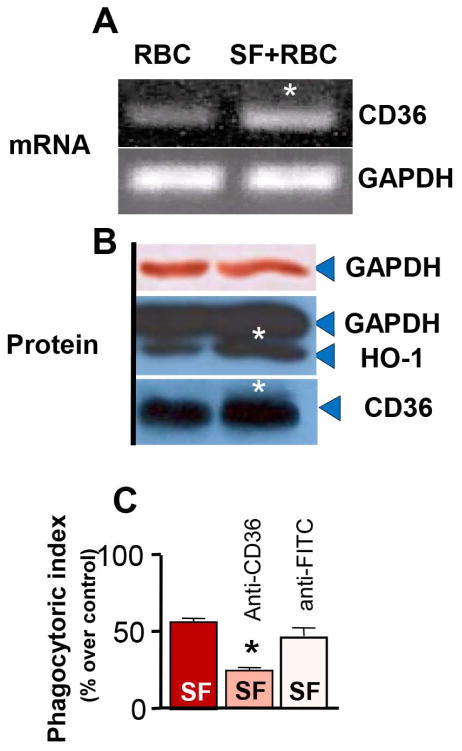
Fig 3.
(A) Photograph of RT-PCR gels showing CD36 and GAPDH gene expression profile and (B) CD36, HO-1 and GAPDH protein expression levels in rat microglia upon exposure to RBC or RBC+2 μM SF for 6h. GAPDH is used as an internal control – the same GAPDH band was visualized using alkaline phosphatase (brows; upper band) and ECL (lower band). (C) Phagocytosis Index of rat microglia at 2h after exposure to CFDA-RBC in presence of 2μM SF in microglia treated with or without 10 μg/ml of anti-CD36 or anti-FITC antibodies (isotope control). The data are expressed as mean±SEM (n=3 independent experiments). *p ≤0.05, compared with all other groups.

