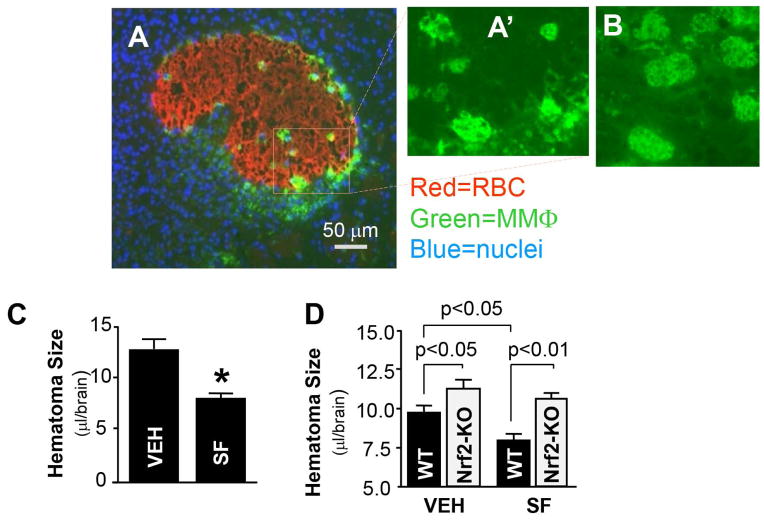
Fig 4.
(A) Photomicrograph of hematoma in rat brain on day 7 after ICH, double-stained with anti-RBC (red) and anti-CD68 (green) antibodies. The panel A″ and B shows the close-up morphology of CD68+-microglia/macrophages at the hematoma-affected brain at 7 and 3 days after ICH, respectively. (C) Hematoma size on day 10 after ICH in the SD rats treated with vehicle (10% corn oil in PBS) or SF (2.5 mg/kg at 30min and 24h after ICH). The data (mean±SEM, n=7) are expressed as the blood volume in the ICH-affected brain tissue. *p ≤0.05, compared with the vehicle control. (D) Hematoma size on day 7 after ICH in WT and Nrf2-KO mice treated with vehicle (10% corn oil in PBS) or SF (5 mg/kg at 30min and 24h after ICH). The data (mean±SEM, n=5–7) are expressed as the blood volume in the ICH-affected brain tissue.

