
Figure 3. NIR-LLLT combined with PDT induced ROS generation determined by flow cytometry.
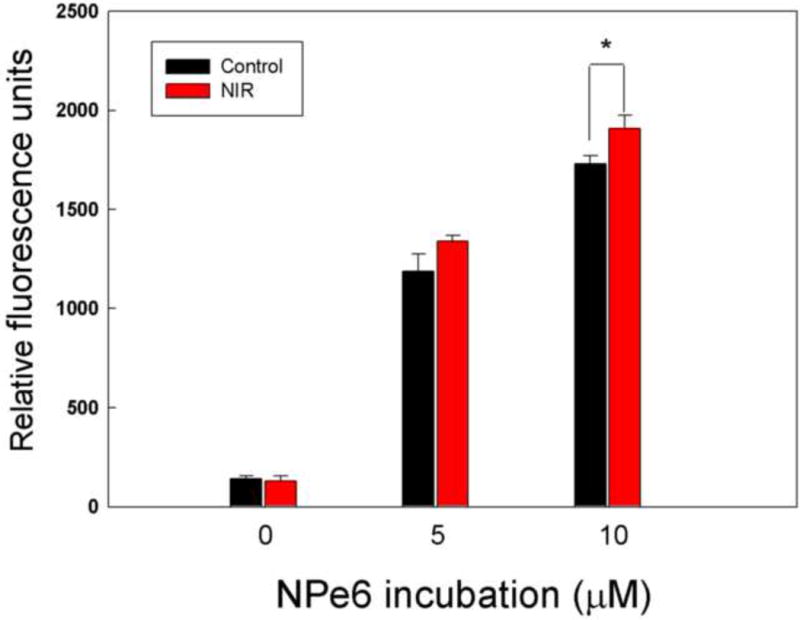
MG-63 cells were pretreated with 1.5 J/cm2 of 810 nm NIR-LLLT and incubated with NPe6 for 2 h, exposed to 1.5 J/cm2 652 nm red light, and then stained with H2DCFDA for 30 minutes to measure the level of ROS by flow cytometry.
Data are the mean ± SD of the fluorescent signal. An asterisk represents the p value < 0.05 as a significant difference between control and NIR-treated cells. All results in this figure are representative of experiments performed in triplicate.