
Figure 2. Gain and loss of miRNA in Aedes aegypti and Anopheles stephensi.
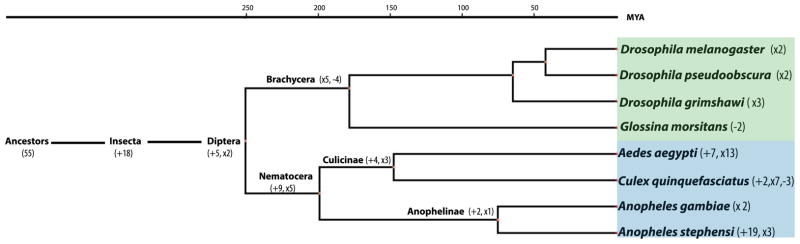
The gain and loss of miRNA in Ae. aegypti and An. stephensi were inferred based on the species distribution of miRNAs. Numbers in parentheses are the number of mosquito miRNAs that were gained (+) or lost (−) from that node; ‘x’ indicates expansion of existing miRNAs (i.e. miR-a/b and 1/2). The evolutionary time scale is adopted from (Liu et al., 2010). The names of specific miRNAs gained/lost/expanded are shown in Table S5.