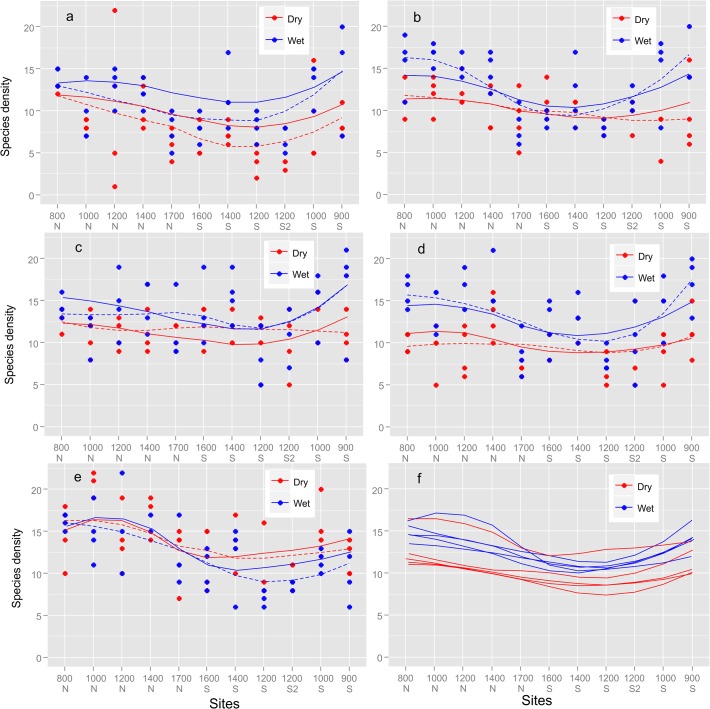
Fig 3. Species Density different Sampling Season.
Species density for different sampling events (10 surveys) across the elevational sites in the Soutpansberg mountain range (2009–2014) predicted from the model, red lines (dry season) September survey and black lines (wet season) January surveys and also for all years (ten in total) combined. Also a plot for species density against all 10 surveys for all elevational sites from northern aspect to southern slope overtime (September 2009—January 2014), similarly top lines, red line = dry season and black lines = wet season.

