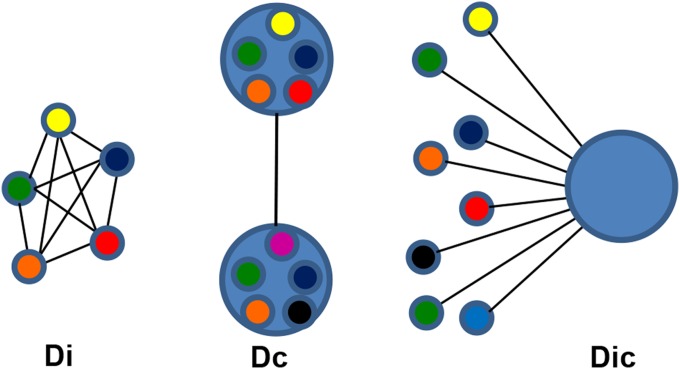
Fig 2. Schematic diagram of population comparisons for differentiation.
Di—Small circles represent infrapopulations infecting a single host. The individuals in the infrapopulations are heterogeneous, but they are all represented by a single color, their average allele frequency. Each line is a discrete value for the pairwise Jost’s D between infrapopulations. The Di’s of infrapopulations from a group of hosts are summarized by the average. Dc—Large circles represent component populations made up of all the parasites in an area or a group of hosts with the same epidemiologic characteristic. The Dc is calculated from the combined allele numbers for all members of the component population compared to the allele numbers from the comparison group. From a comparison of the 2 groups, a single value for Jost’s D is calculated. Dic—This compares the allele frequencies of individual infrapopulations to the combined allele frequency of their source component populations. Each infrapopulation will be characterized by a single value for Jost’s D that represents its relative similarity to the component population. The Dic’s of infrapopulations from a group of hosts are summarized by their average.

