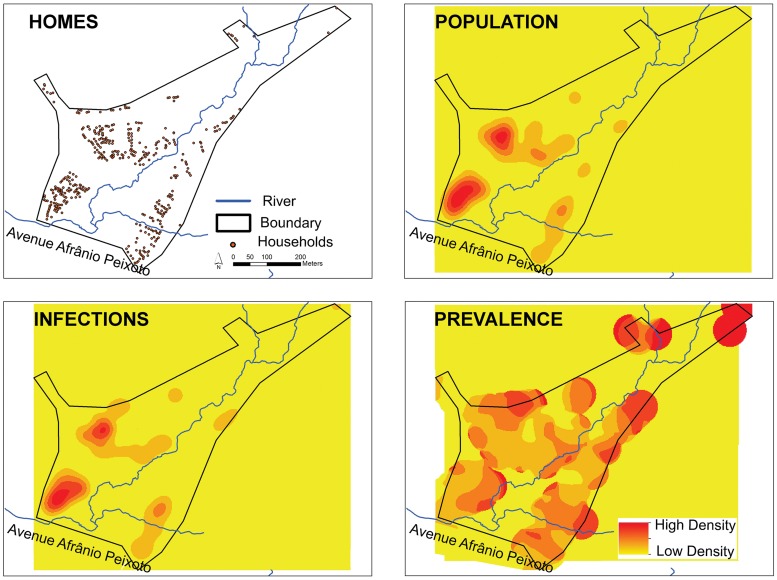
Fig 4. Kernel density analysis of the prevalence of S. mansoni infection in São Bartolomeu.
The spatial unit of reference is the home and each participant in the study was geo-referenced with their respective positive or negative parasitological result. Density analyses were generated with use of the Kernel density estimator implemented in the software ArcGIS spatial analyst extension 10.1. Density analyses were generated with bandwidth (search radius) of 50 meters. The location of Homes, the location and number of the human Population, the location and number of Infections and the Prevalence density (Infections/Population) are shown.

