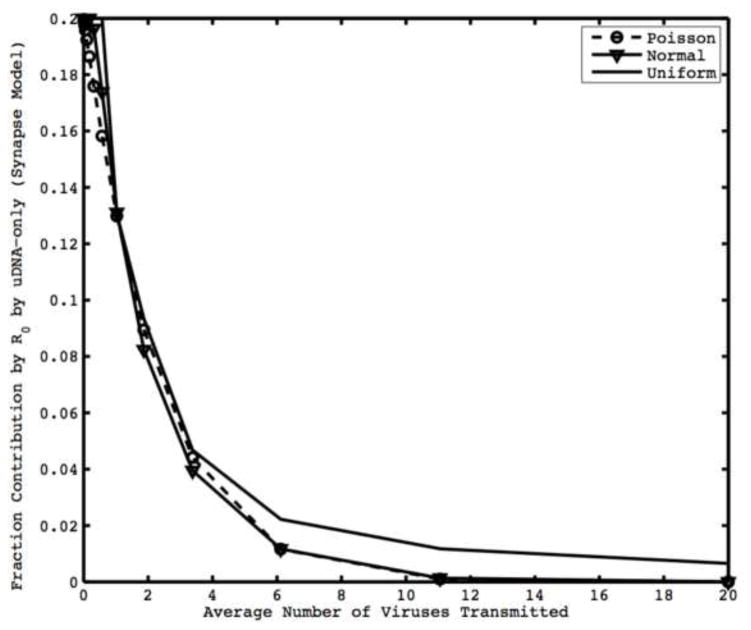
Figure 2.
Fraction contribution to R0 by cells with uDNA-only for synaptic transmission. Lines are different distributions of the number of viruses transferred per synapse. The contribution to R0 by uDNA depends on average number of viruses transmitted but remains relatively constant with respect to the distribution of viruses transmitted. We assume that viruses integrate independently. Parameters are λ =10000, d=0.01, η=0.25, p=0.5, c=1, ai=0.7, au=0.7.

