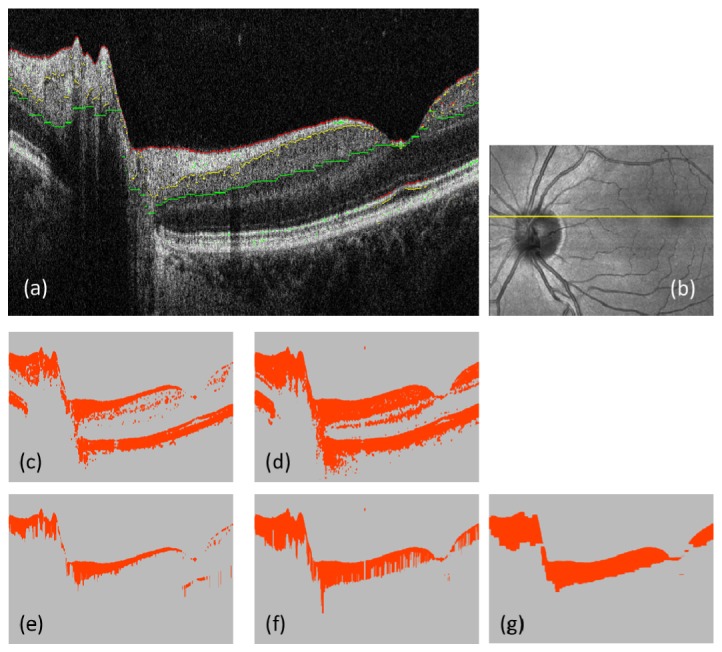
Fig. 2.

Segmentation of ILM, NFL/GCL and IPL/INL interfaces. (a): Intensity B-scan; red, yellow, and green pixels indicate the segmented boundaries of ILM, NFL/GCL and IPL/INL. (b): Intensity projection; yellow line indicates the position of B-scan. (c) and (d): Binarization results; using intensity thresholds (3.7 for (c), and 3.9 for (d) in log10 scale); orange color: foreground pixels, gray color: background pixels. (e) and (f): Uppermost connected sets of the foreground pixels along each A-scan; processed from (c) and (d), respectively. (g): Result of applying a series of morphological image processing (cascaded dilations and erosions) to (f).
