
Fig. 4.
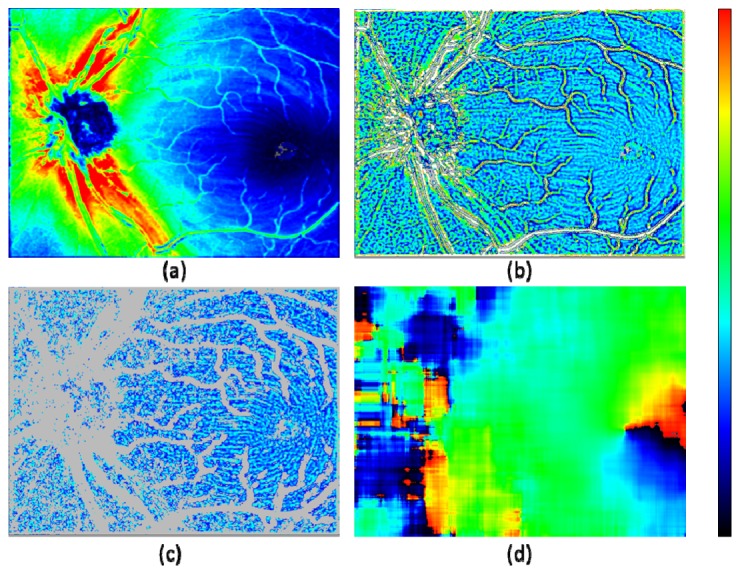
Fiber bundle orientation detection by NFL thickness map. (a): NFL thickness map; color scale: 0 – 180 μm. (b) Local thickness variation calculated by an adaptive filtering; color scale: −8 – + 15 μm (gray color: < −8 μm; white color: > + 15 μm). (c) Selected pixels from (b), having local thickness variation within −2 – + 2 μm range; a morphologic image processing (erosion and dilation by 1 pixel in both horizontal and vertical directions) was applied; color scale: −4 – + 9 μm (gray color: pixels excluded from processing). (d) Fiber bundle orientation calculated by local gradient of (c) within 120 × 120 pixel evaluation window; color scale: −90° – + 90°.