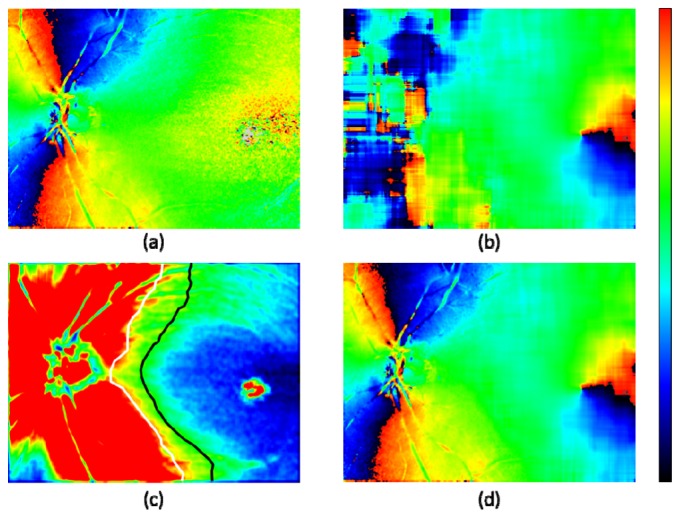
Fig. 5.

Fusion of ONH and foveal zone maps for fiber orientation. (a): Axis orientation obtained by polarization data from PS-OCT (5 frame averaged). (b): Fiber bundle orientation obtained by NFL thickness map. (c): Retardation; color scale 0° – 8°; white and black lines: boundaries of 7° and 5°, respectively. (d): Combined orientation from (a) and (b); low retardation zone with < 5° of (a) is replaced by corresponding zone of (b), and transition zone from 5° to 7° is linearly interpolated.
