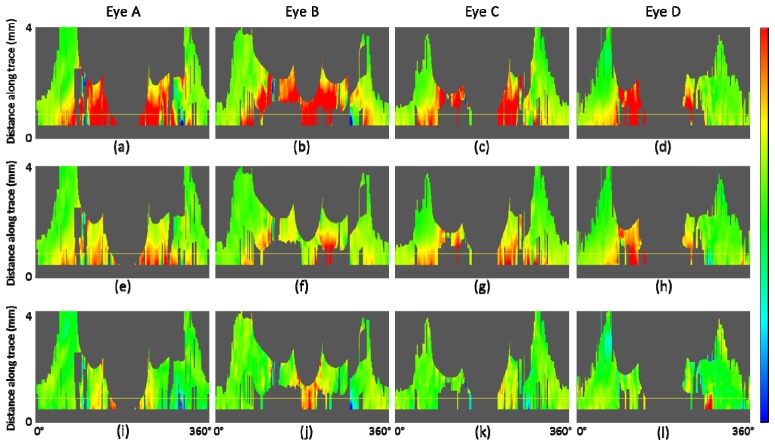
Fig. 13.
Gradient maps along the trace in healthy eyes A, B, C, D in comparison. (a) – (d): NFL retardation gradient, (e) – (h): NFL thickness gradient, (i) – (l): NFL UDR gradient. Horizontal yellow line indicates position at distance of 1.7 mm from the ONH center; gray pixels indicate too low number of pixels for fitting. Color scale: + 1 (blue) – −1 (red).

