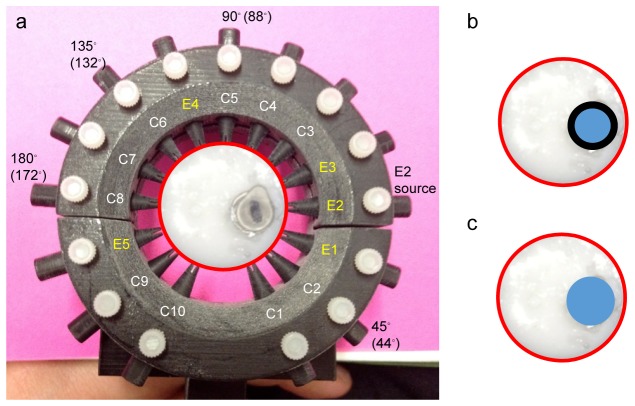
Fig. 4.
Photograph (panel a) of an example tissue phantom in the fiber holder. During experiments, the “bone” inclusion was removed from the centrifuge tube and inserted into the outer “soft tissue” phantom. The illumination pattern is shown on the interior of the fiber holder, using E1-E5 to denote excitation fibers and C1-C10 to denote collection fibers. E2 was the excitation fiber used. Raman data were collected from all 10 collection fibers. Approximate degrees of separation for C2, C5, C6 and C8 are shown exterior to the fiber holder. Data from these collection fibers are presented in Figs. 7 and 8. Panel b is a cartoon of the bone inclusion inside the phantom while inside the polymer centrifuge tube, representing a 2-layer inclusion. Panel c is a cartoon of the bone inclusion inside the phantom after it has been removed from the polymer centrifuge tube, representing a single layer inclusion.

