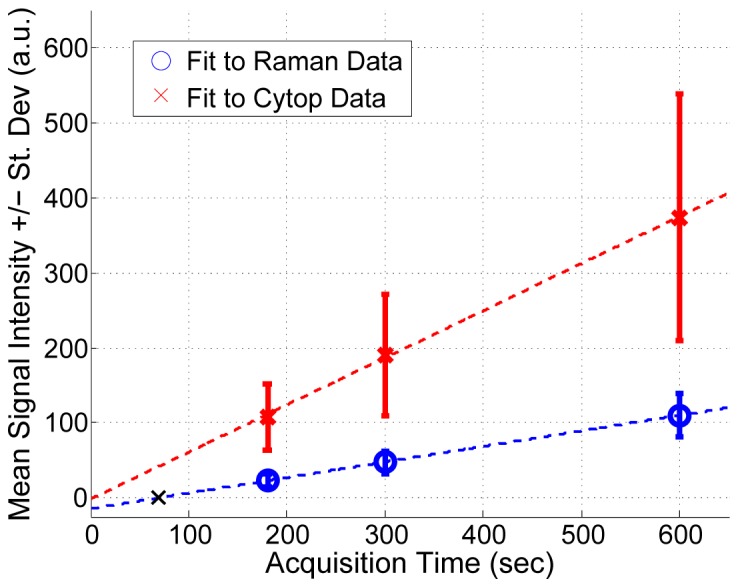
Fig. 5.

Multiple Raman measurements were collected from the same animal without changing the location of the optical fibers to determine the linearity of Cytop and Raman signals with integration time. As expected, Cytop and Raman signals scale linearly with time. This study suggests that a minimal integration time of 69 seconds, indicated by a black X, in the “Fit to Raman Data” trend line would provide Raman signal above the noise floor.
