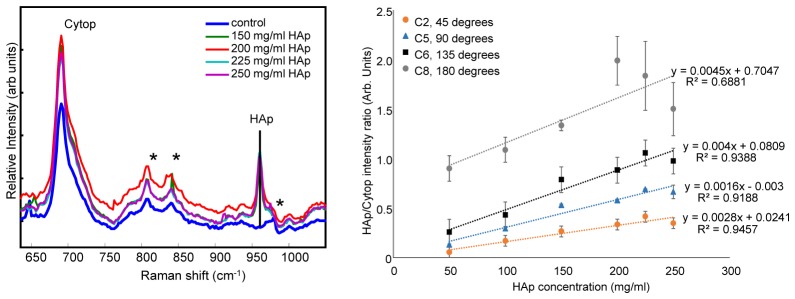
Fig. 8.

Raman spectra of tissue phantoms were used to determine noise floor and attenuation region for the measurement of HAp with the current system. These measurements were performed with the 2-layer bone inclusion, which was the “bone” phantom inside its plastic centrifuge tube. Panel a shows Raman HAp signal normalized to Cytop Raman signal is shown against the concentration of HAp in the “bone” inclusion. The spectra show signatures from Cytop, centrifuge material (denoted with an *) and HAp. The control inclusion does not have any signatures from HAp. Panel b shows normalized HAp signal from collection fibers corresponding to approximately 45◦, 90◦, 135◦ and 180◦. The data shows trends of increased Raman signal collected at 180◦ and increased spread at higher HAp concentrations.
