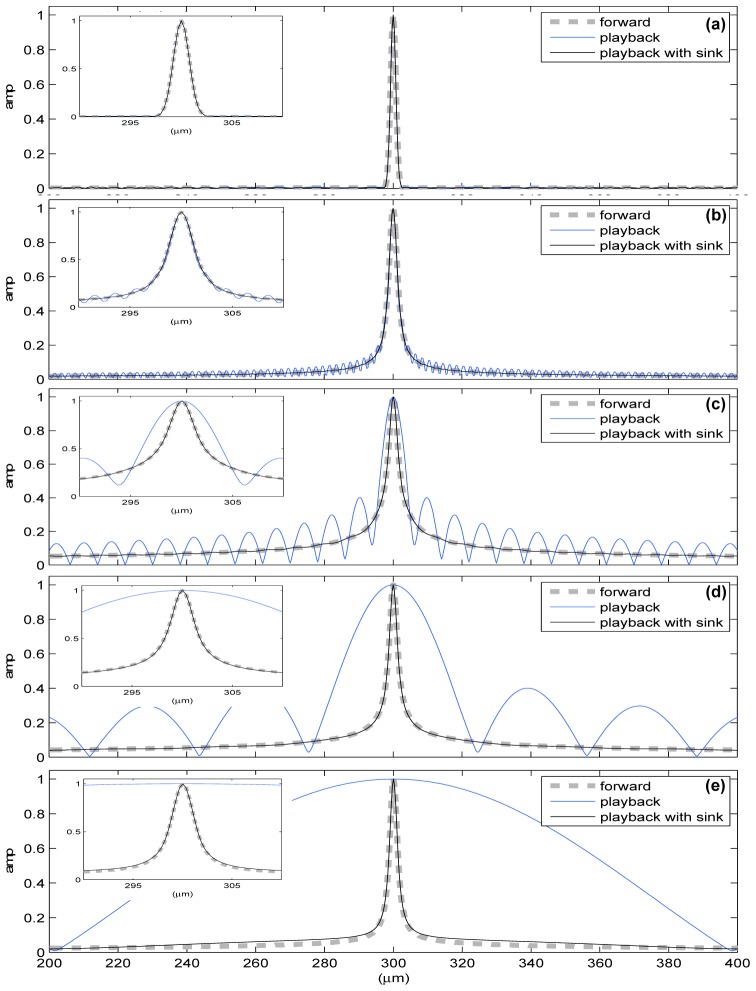
Fig. 8.
( Media 3 (1.7MB, MOV) ) Simulation of light back-propagated through vacuum to a narrow peak. A 4-μm-wide plane-wave light source (wavelength λ) is embedded at the center of the simulation. From top to bottom: (a) λ = 1 μm, (b) λ = 4 μm, (c) λ = 16 μm, (d) λ = 64 μm, (e) λ = 256 μm, respectively. In each subplot, the forward propagation light profile (gray dashed line) is compared to the back-propagated light (blue line) and the back-propagated light with a soft sink to eliminate the outgoing light component (black line). A zoomed-in view is shown in each inset-figure. Before eliminating the outgoing field component the root-mean-square error is: (a) 0.23%, (b) 1.84%, (c) 9.32%, (d) 30.29%, and, (e) 65.68%, respectively; after eliminating the outgoing light component, the root-mean-square error is: (a) 0.17%, (b) 0.089%, (c) 0.20%, (d) 0.208, and, (e) 0.17%, respectively. The FWHM is: (a) 1.8 μm, (b) 3.3 μm, (c) 5 μm, (d) 3.6 μm, (e) 3.1 μm, respectively. It is clear that the peak width of the forward light and back-propagated light profiles are identical.

