
Fig. 7.
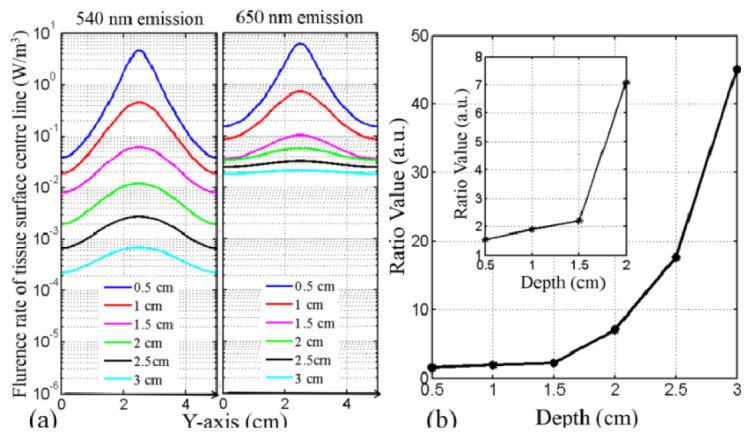
(a). UC 540 nm (left) and 650 nm (right) emission fluence rate on the tissue surface with tumor located at different depths; (b). peak UC PL fluence rate ratios of 650 nm and 540 nm emission as a function of depth.
Official websites use .gov
A
.gov website belongs to an official
government organization in the United States.
Secure .gov websites use HTTPS
A lock (
) or https:// means you've safely
connected to the .gov website. Share sensitive
information only on official, secure websites.
(a). UC 540 nm (left) and 650 nm (right) emission fluence rate on the tissue surface with tumor located at different depths; (b). peak UC PL fluence rate ratios of 650 nm and 540 nm emission as a function of depth.