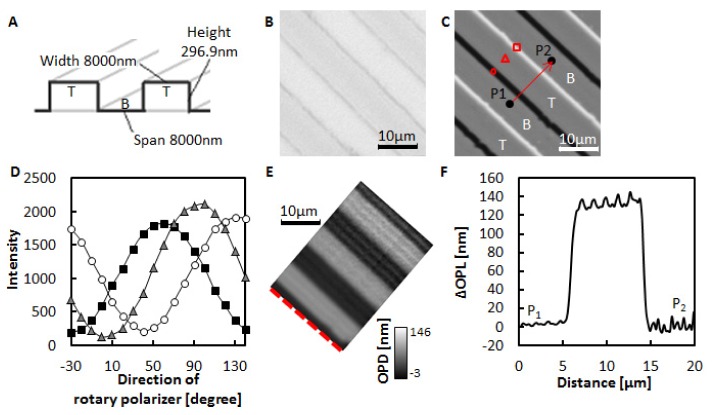
Fig. 2.
(A) A fused silica glass plate with grooves. T and B indicate the top and bottom region of the plate, respectively. (B) Transmitted light image of the plate. (C) DIC image of the plate when the rotary polarizer angle was 40°. T and B correspond to the T and B shown in (A). (D) Intensity changes upon rotation of the polarizer. The indicators show the light intensities at the corresponding positions in (C). (E) ΔOPL map of the plate. The ΔOPLs on the red dotted line were set to 0 nm. (F) Changes in ΔOPLs along the shear direction. ΔOPL at P1 is set to 0 nm. P1 and P2 are the points shown in (C).

