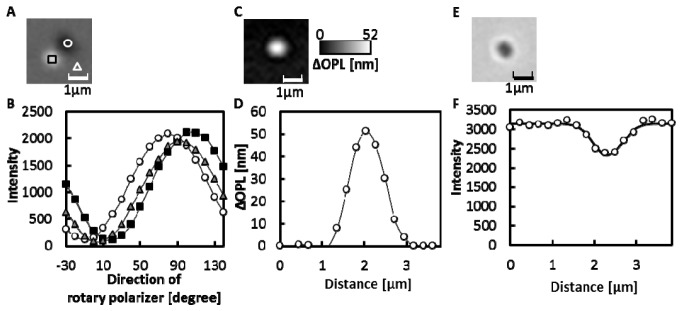
Fig. 3.

Measurements of a silica bead with a diameter of 1μm. (A) DIC image of a silica bead in water when the direction of the rotary polarizer was 150°. (B) The changes in light intensity upon rotating the rotary polarizer. Circles, triangles and squares indicate the intensity at the corresponding regions shown in (A). The solid lines are the curves obtained by fitting Eq. (1) to the data. (C) ΔOPL map of a bead. (D) Changes in ΔOPL along a line through the center of the bead image (open circle). The solid line shows the interpolation curve. (E) Transmitted light image of a bead. (F) Changes in the intensity of the transmitted light along a line through the center of the bead image (open circle). The solid line shows the approximated curve obtained by fitting the Gaussian function to the data.
