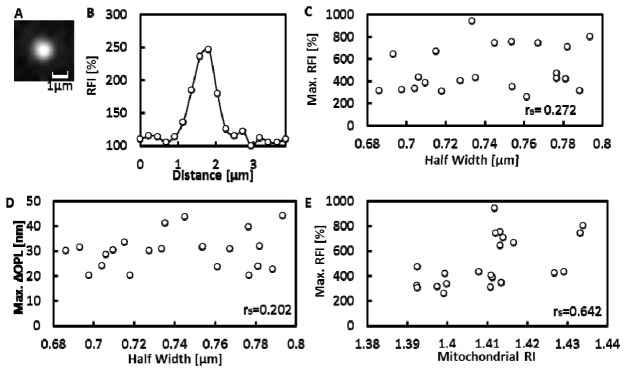
Fig. 7.

The correlation between Max.ΔOPL and TMRE fluorescence of mitochondria. (A) TMRE fluorescence image of a mitochondrion. (B) Changes in RFIs along a line through the center of the mitochondrion image. (C-E) Isolated mitochondria with half width of 680-800 nm were analyzed (N = 22), rs is the Spearman's rank correlation coefficient. (C) The correlation diagram between Max.RFI and half width of isolated mitochondria. (D) The correlation diagram between Max.ΔOPL and half width. (E) The correlation diagram between RI and Max.RFI of isolated mitochondria The RI was calculated with Eq. (3) by assuming the RI of silica beads was 1.43.
