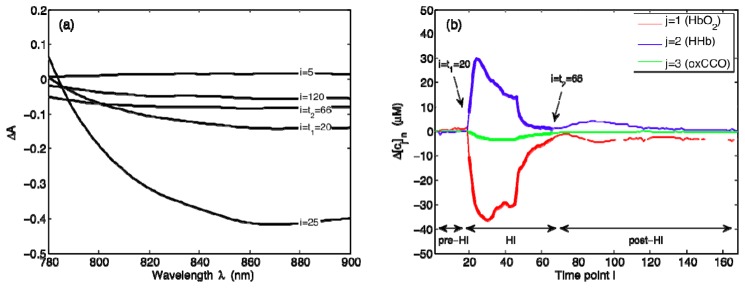
Fig. 2.

NIRS-based quantification of changes in cerebral chromophore concentrations. (a) Sample ∆A measurements at selected time points i, and (b) gold standard values of Δ[cj], where cj represents the jth chromophore with j = 1, 2, and 3 corresponding to HbO2, HHb, and oxCCO, respectively. Time points i are in minutes. For this representative dataset, i = t1 = 20 marks the beginning of HI and i = t2 = 66 marks the end of HI.
