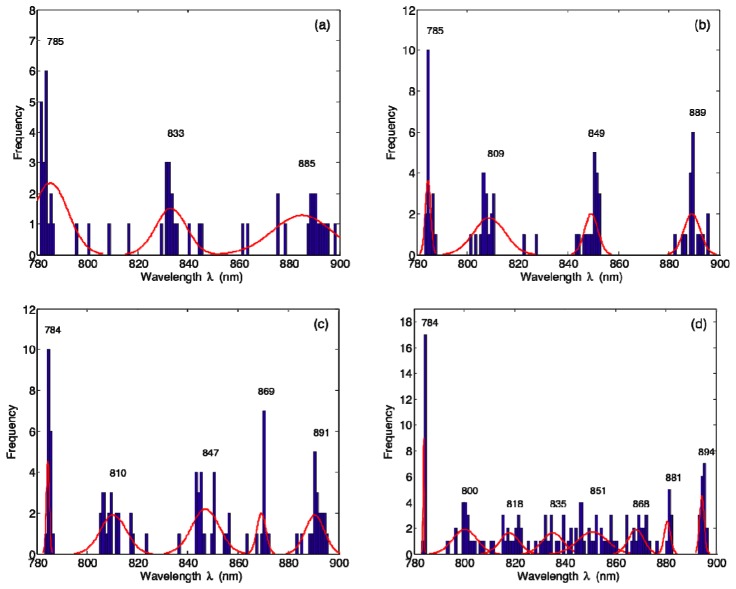
Fig. 4.
Histograms of GA-derived optimal wavelength combinations for (a) k = 3, (b) k = 4, (c) k = 5, and (d) k = 8. The results of k-means clustering applied to GA-derived wavelengths are displayed as Gaussian curves overlaid on the histograms; these curves have been generated using the values reported in Table 1 and each has been normalized to the mean frequency of its respective cluster.

