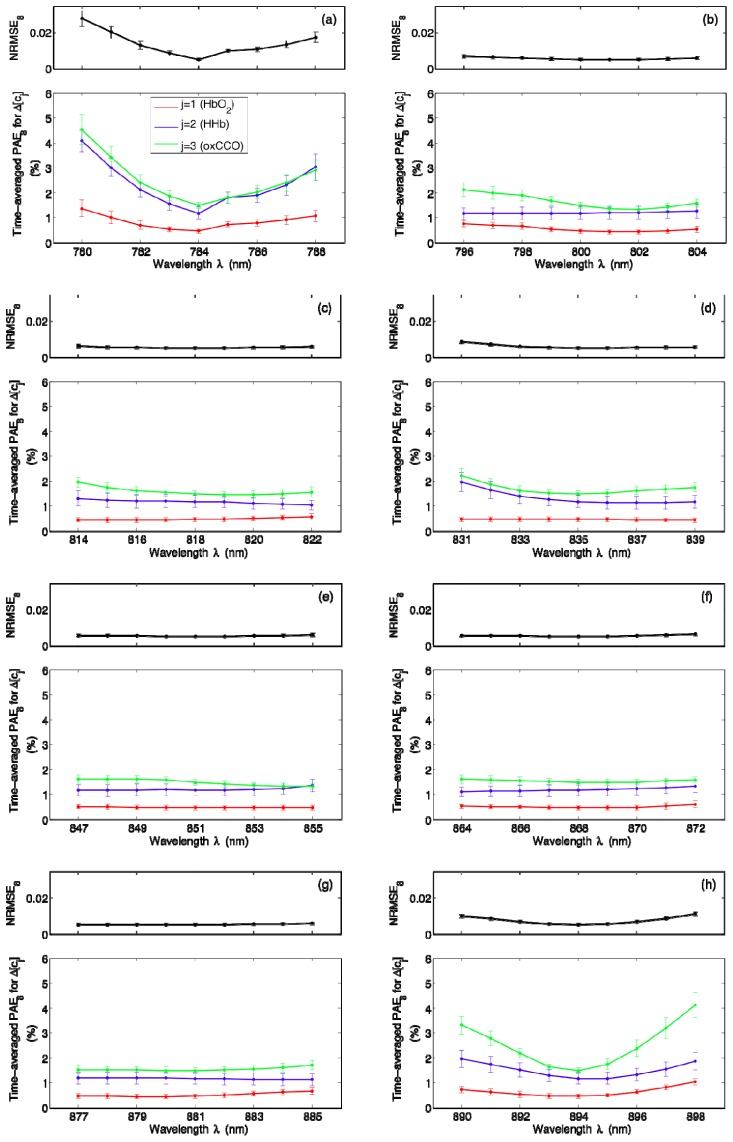
Fig. 8.
Wavelength dependence of NRMSE8 and time-averaged PAE8 for ∆[cj], where cj represents the jth chromophore with j = 1, 2, and 3 corresponding to HbO2, HHb, and oxCCO, respectively. Each of the eight wavelengths listed in Table 1 is perturbed one at a time up to ± 4 nm and the resulting error metrics are plotted in (a)–(h). The means and standard errors shown are over all 18 datasets.

