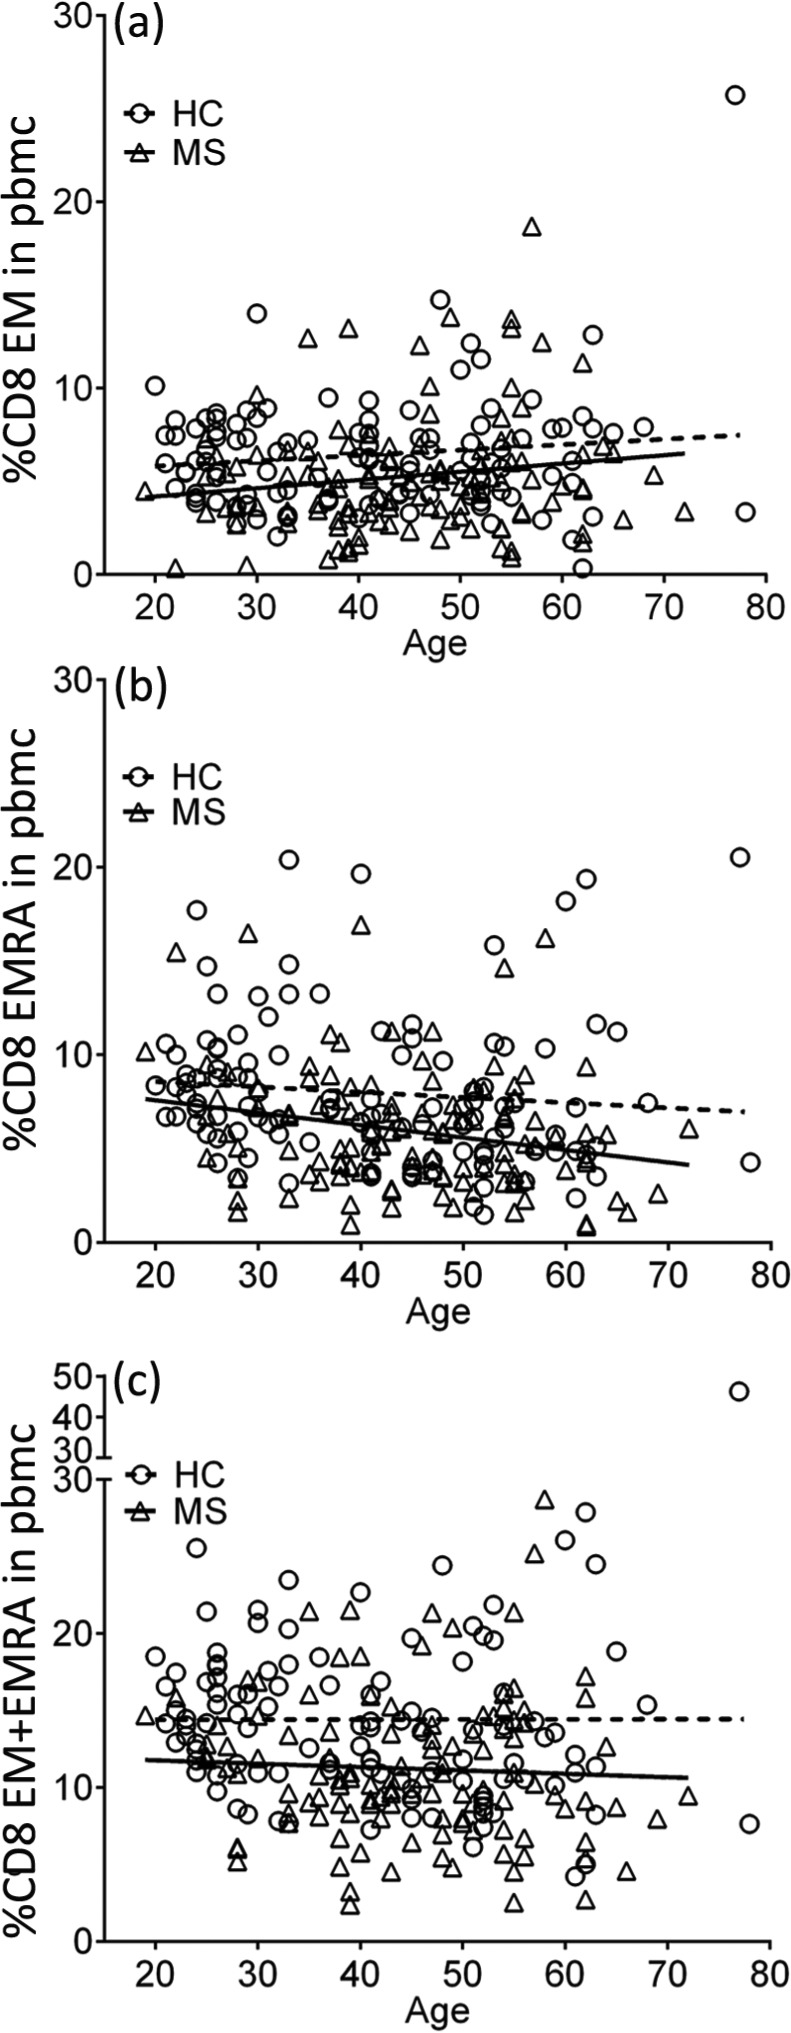
Figure 2.

Percentages of CD8+ EM (a), EMRA (b) and EM/EMRA (c) T cells in PBMCs in healthy subjects (HC) and the total group of MS patients (MS) plotted against age in years. On multiple linear regression analysis, the slopes of the regression lines are not significantly different but the y intercepts (elevations) for the MS patients are significantly different from those for the healthy subjects (p = 0.0027; p = 0.0001; p <0.0001, respectively).
