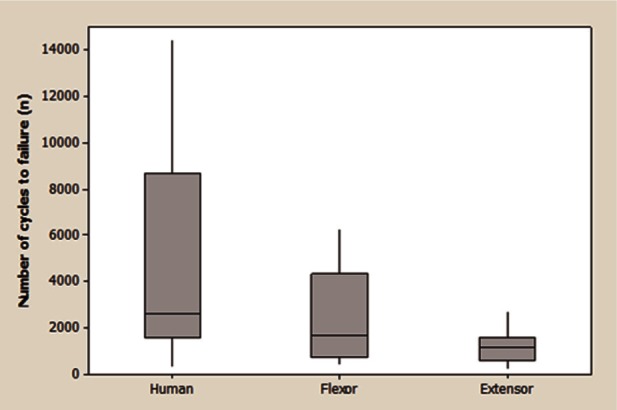
Figure 6.

Box and whisker plot summarising number of cycles to failure during creep testing for the 3 tendon types. The horizontal line within the box indicates the median, boundaries of the box indicate the 25th (Q1) and 75th (Q3) percentile, the upper whisker indicates the highest data value within the limit Q3+1.5(Q3-Q1) and the lower whisker the lowest data value within Q1-1.5(Q3-Q1).
