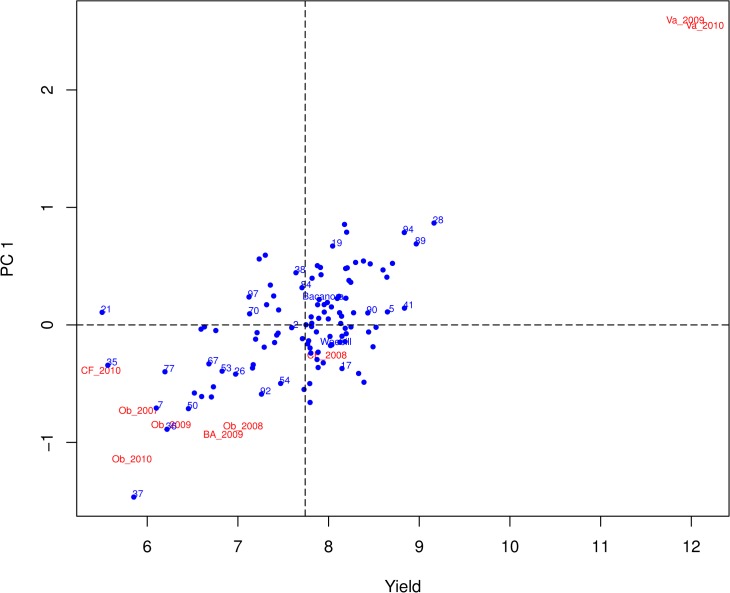
Fig 1. AMMI 1 plot of grain yield for Weebill, Bacanora, and WxB segregating population.
See Tables A and B in S1 File for full descriptions of environments. Yield is the mean of all environments shown. Genotype close to 0 for PC1 (Principal component 1) show low levels of environmental interaction for this trait. Proximity to an environment data point indicates that the genotype in question is relatively well adapted to that environment.

