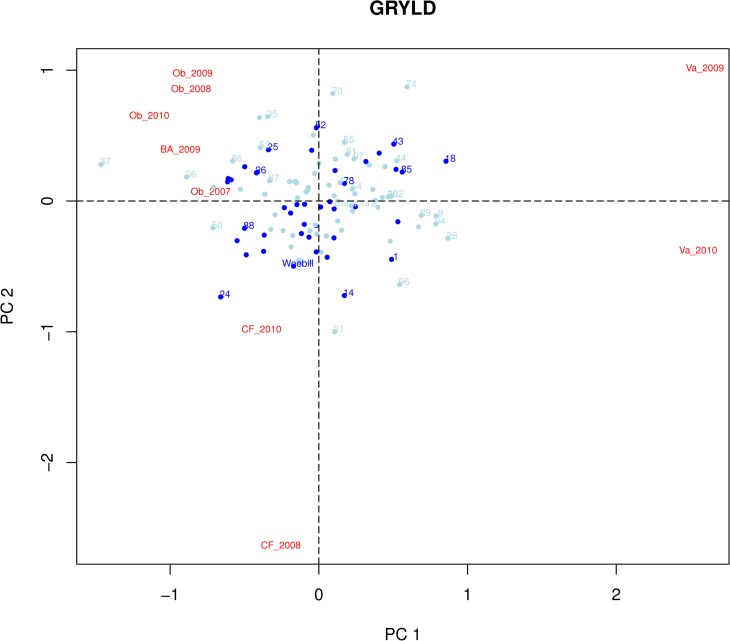
Fig 2. AMMI 2 plot.
Principal components 1 and 2 from AMMI analysis of grain yield are plotted against each other. Genotypes closest to zero for PC1 and PC2 show the highest levels of yield stability. Genotypes carrying the Weebill (increasing) allele of the 7B grain size QTL are shown in dark blue.

