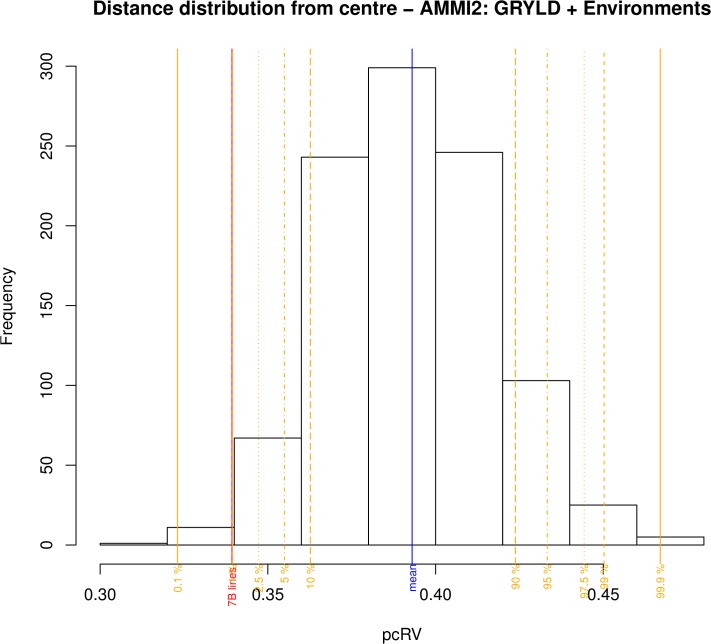
Fig 4. Estimating the effect of 7B grain yield QTL on yield stability.
The distribution represents the frequency of summed distances from the point of AMMI2 plots where PC1 and PC2 are equal to zero in 1000 random permutations for the number of lines carrying the Weebill allele of the 7B GRYL QTL described in the text. The summed distances for actual data set (dark blue circles in Fig. 2) occurred in less than 2% of the simulated data sets, marked with vertical red line labelled 7B.

