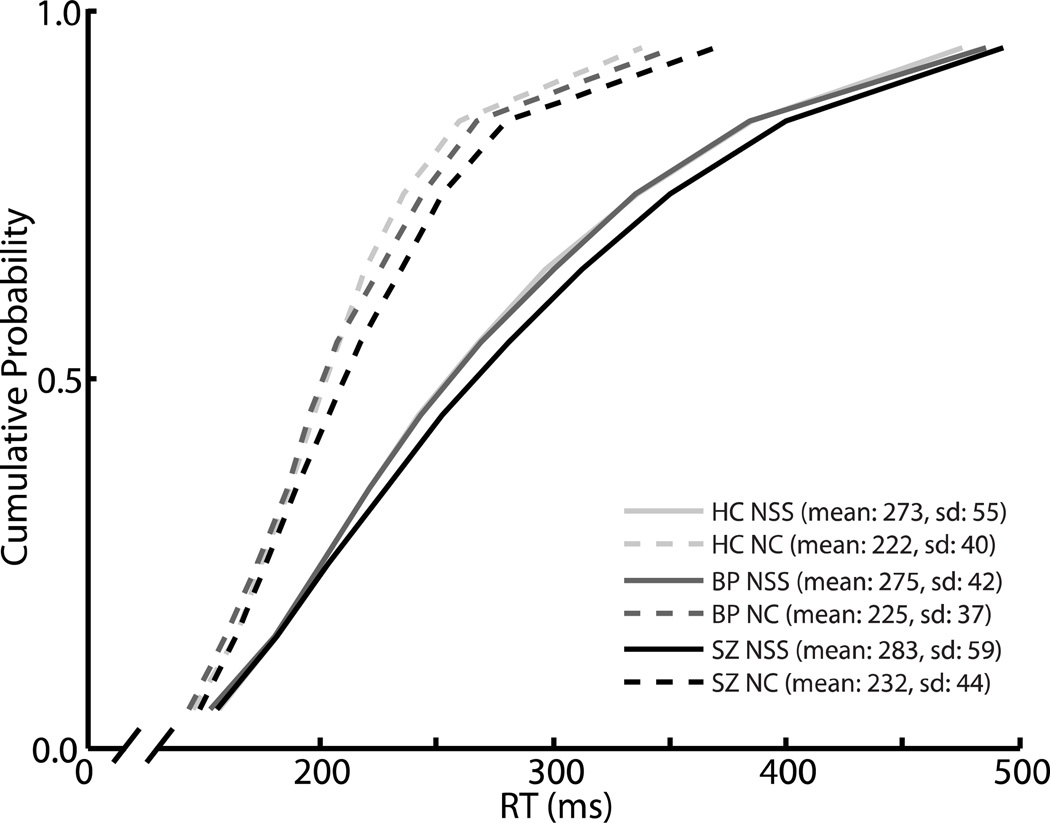
Figure 2. RT distributions.
Vincentized cumulative distributions of saccade latencies in no-stop signal (dotted lines) and non-cancelled (solid lines) trials for healthy controls (light gray), bipolar patients (dark gray), and schizophrenia patients (black). For each subject, mean RT for each decile was calculated. Then, for all three groups, the mean RT at each decile was averaged across participants.

