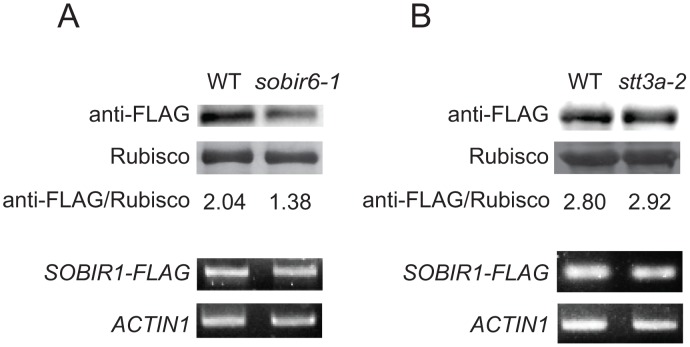
Fig 6. Accumulation of SOBIR1 protein in sobir6–1 and stt3a-2.
(A) Western blot analysis of SOBIR1-FLAG protein level (top) and RT-PCR analysis of SOBIR1-FLAG expression (bottom) in wild type (WT) and sobir6–1 mutant background. (B)Western blot analysis of SOBIR1-FLAG protein level (top) and RT-PCR analysis of SOBIR1-FLAG expression (bottom) in WT and stt3a-2 mutant background. Protein and RNA samples were extracted from 12-day-old seedlings grown on half-strength MS plates at 23°C. Rubisco was used as protein loading control and ACTIN1 was used as RNA control.

