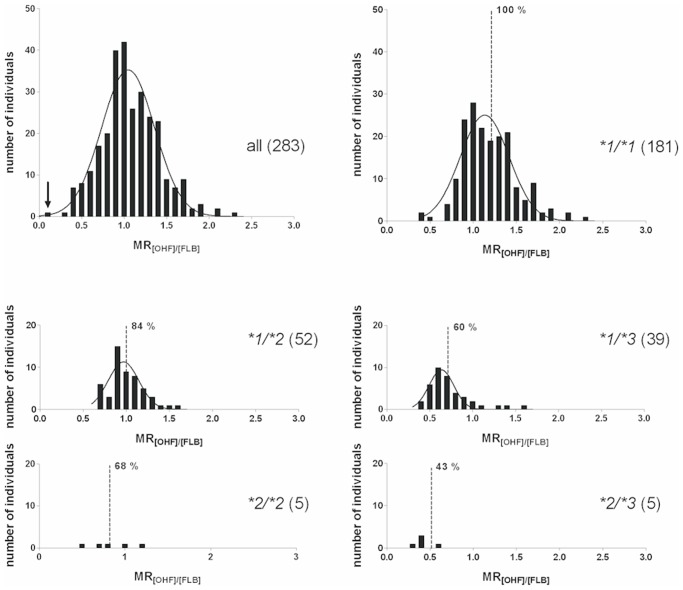
Fig 2. Histograms.
Distribution of the metabolic ratio (MR; concentration of 4’-hydroxyflurbiprofen [OHF] divided by the concentration of flurbiprofen [FLB]) measured in urine 2 h after administration of flurbiprofen to 283 individuals. Histograms are shown for the entire study group and for the genotypes with more than one individual. One single individual with genotype CYP2C9*3/*3 showed an MR of 0.096 (highlighted by an arrow in the histogram). The dashed lines indicate the best estimates of model-derived MRs, together with the FLB dose adjustment in percent of wild type *1/*1 (= 100%).

