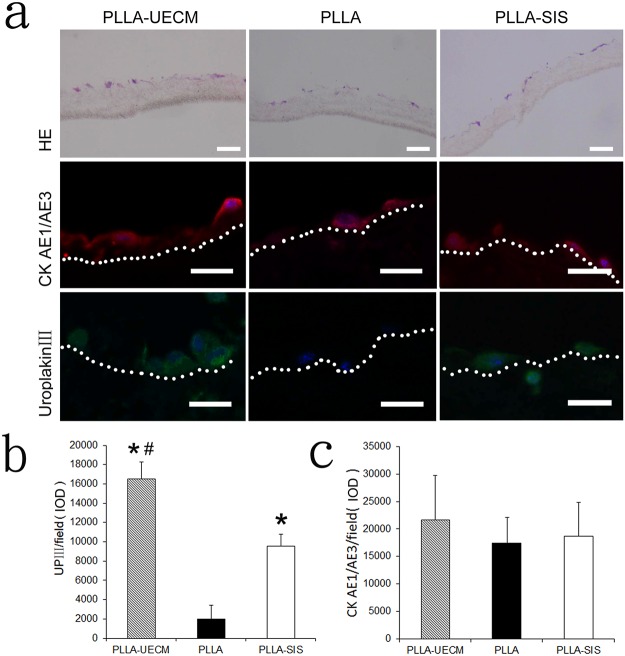
Fig 3. (a) H&E staining showed that the seeded cells remained in the scaffolds and mainly gathered on the surface of the scaffolds. Immunofluorescence staining showed that more cells present in the PLLA-UECM scaffold were positive for UPIII compared to those in the PLLA and PLLA-SIS groups. Image analysis by IPP revealed that there was more UPIII expression in the PLLA-UECM group than in the other two groups (b). However, the expression of the non-specific marker CK AE1/AE3 was not significantly different between groups (c). Inset scale bar = 20 μm. #: p<0.05 versus the PLLA-SIS group; *: p<0.05 versus the PLLA group.
The region below the white dotted line represents the scaffold.

